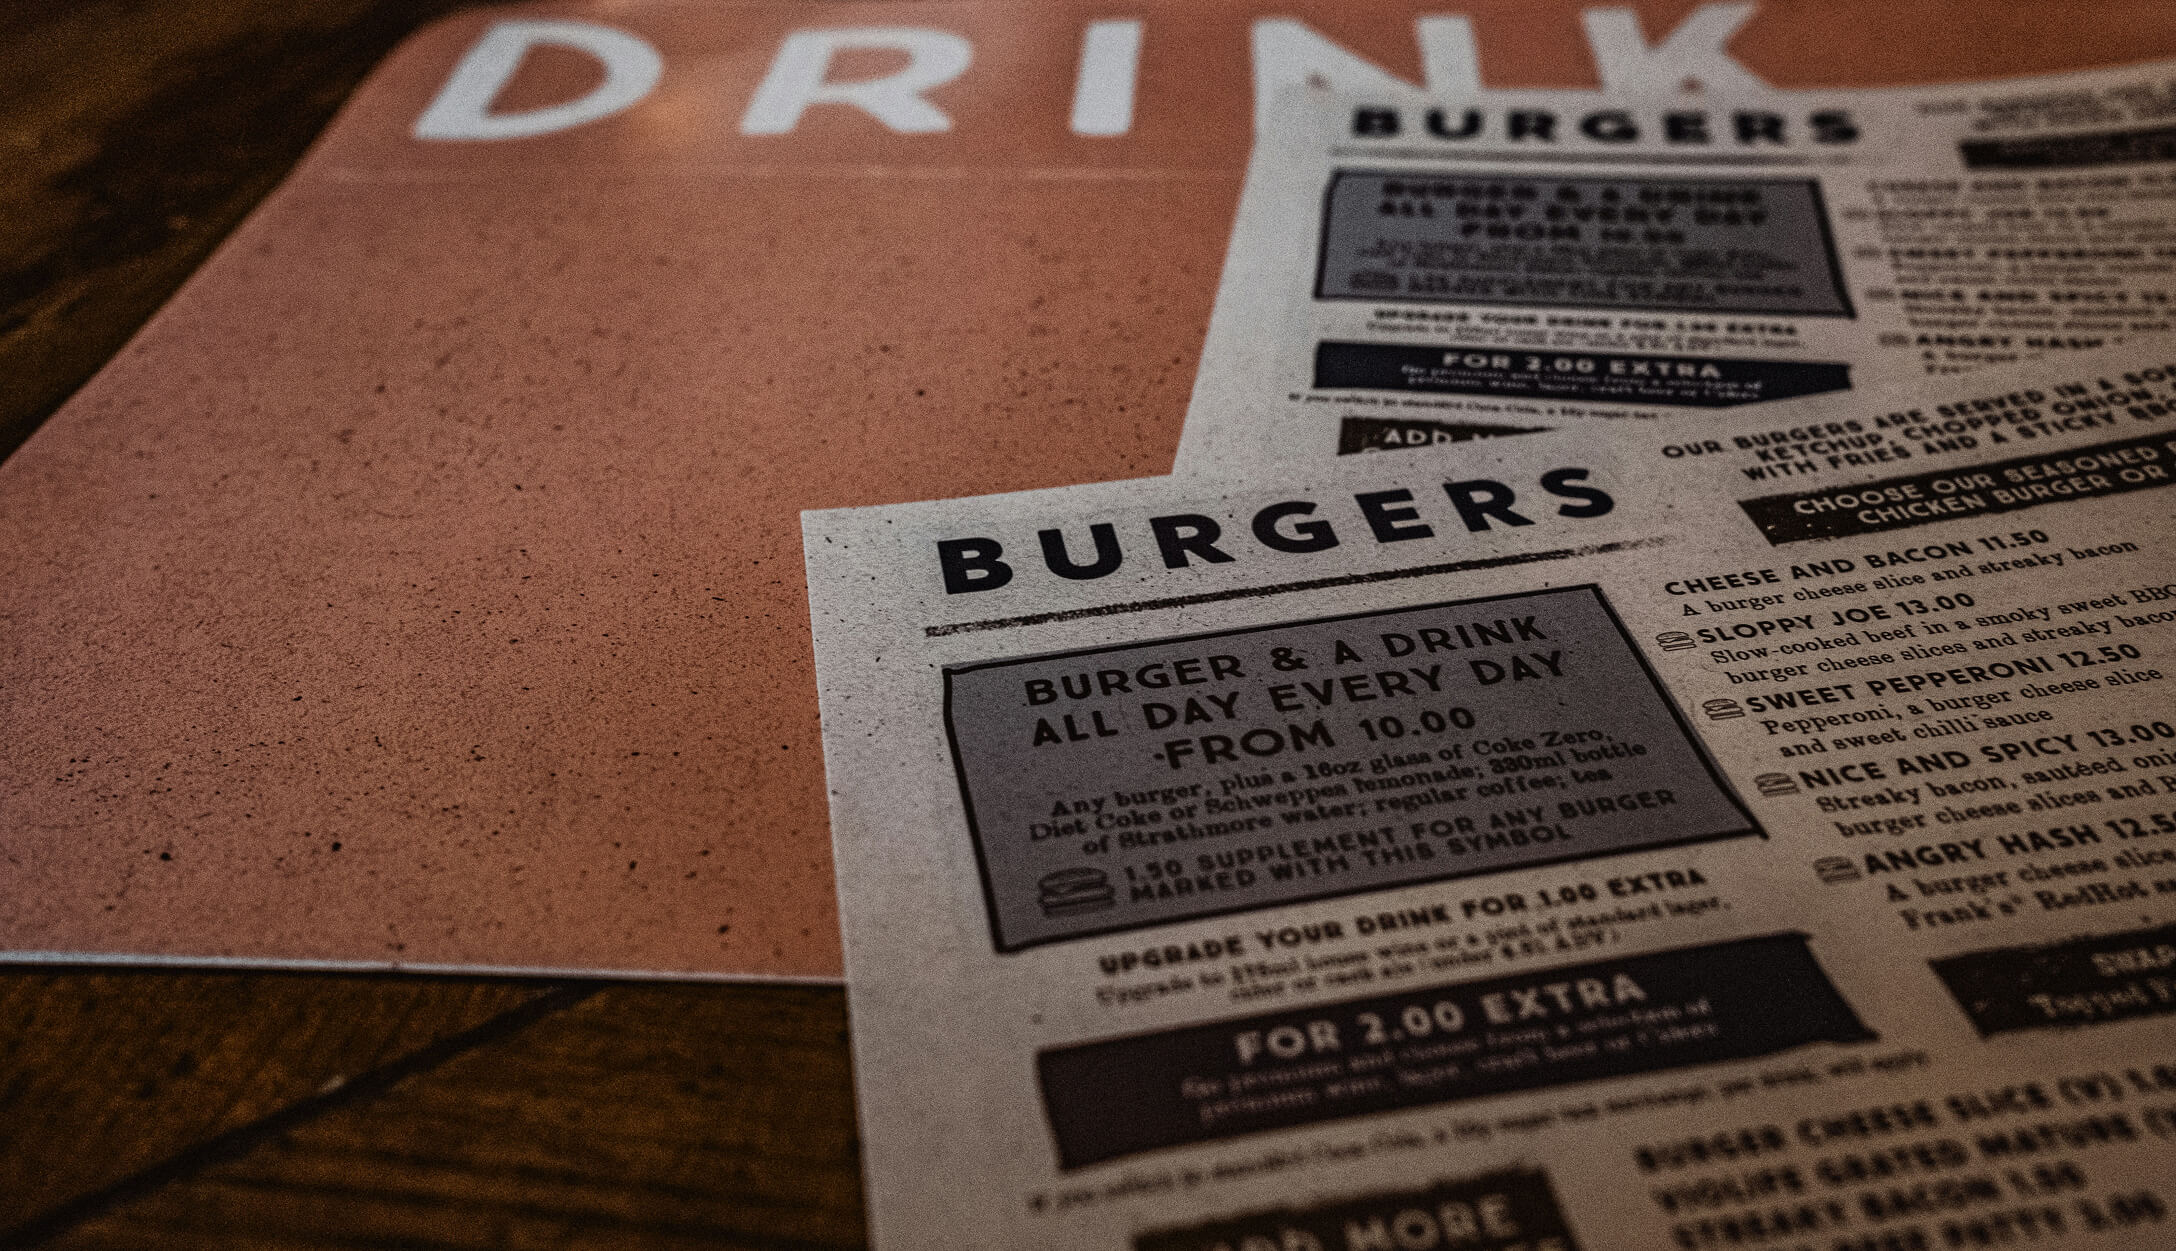
20 Mar
The Menu Engineering Matrix is a powerful analytical tool that helps restaurant owners and managers maximize their profitability by strategically evaluating menu items. This matrix provides a visual representation of your menu’s performance, categorizing dishes based on their profitability and popularity. By plotting items on this matrix, restaurant operators gain valuable insight into which dishes contribute most to their bottom line and which may need adjustment.
At its core, the menu engineering process involves analyzing sales data and food costs to identify which items are truly driving profit and which might be holding your restaurant back. This methodical approach takes the guesswork out of menu planning and pricing, allowing you to make data-driven decisions that directly impact your restaurant’s financial health.
The matrix divides menu items into four distinct quadrants: Stars (high profitability, high popularity), Plow Horses (low profitability, high popularity), Puzzles (high profitability, low popularity), and Dogs (low profitability, low popularity). Understanding how each item in your menu fits into these categories is the first step toward engineering a more profitable menu.
Want to maximize your restaurant’s profits? The Menu Engineering Matrix is the ultimate tool to transform your menu from just a list of dishes into a strategic asset that drives your business forward.
 The Menu Engineering Matrix helps restaurants optimize menu items by providing clear insights into performance metrics that directly affect profitability.
It classifies items into Stars, Plow Horses, Puzzles, and Dogs, giving restaurant owners a framework to understand each dish’s contribution.
When properly implemented, this strategy can increase revenue, reduce costs, and enhance customer experience by focusing on dishes that deliver value.
Menu engineering is a must-have strategy for data-driven menu pricing, allowing restaurants to make informed decisions rather than relying on intuition.
A Menu Engineering Matrix (also known as a menu matrix) is a strategic framework for analyzing menu item performance based on two critical metrics: profitability and popularity. This analytical tool transforms raw sales data into actionable intelligence that restaurant operators can use to make informed decisions about their menu offerings.
The concept was developed in the 1980s by Professor Michael Kasavana and Donald Smith at Michigan State University. Their groundbreaking work introduced restaurant owners to a systematic approach for evaluating menu items beyond simple gut feelings or tradition. The matrix creates a methodology that combines food cost percentage, contribution margin, and sales volume to categorize each dish according to its overall performance.
At its most basic level, the menu matrix works by plotting each menu item on a graph with two axes. The x-axis typically represents popularity (the number of items sold during a specific timeframe), while the y-axis represents profitability (usually measured by contribution margin). By analyzing where items fall on this graph, restaurant owners can identify which dishes deserve prominence on their menu and which might need adjustment or removal.
This analytical approach allows restaurants to strategically engineer their menus for maximum profitability while still meeting customer preferences. Rather than making changes based on assumptions, the menu engineering process provides concrete data that illuminates exactly how each dish contributes to overall restaurant success. This makes it an invaluable tool for any restaurant looking to optimize their menu and improve their bottom line.
The beauty of menu engineering lies in its simplicity and effectiveness. Even small restaurants can implement this technique with basic sales tracking and cost analysis, making it accessible to operations of all sizes.
The Menu Engineering Matrix divides your menu items into four distinct categories, each requiring different strategies to maximize profitability. Understanding these quadrants is key to optimizing your restaurant’s menu performance.
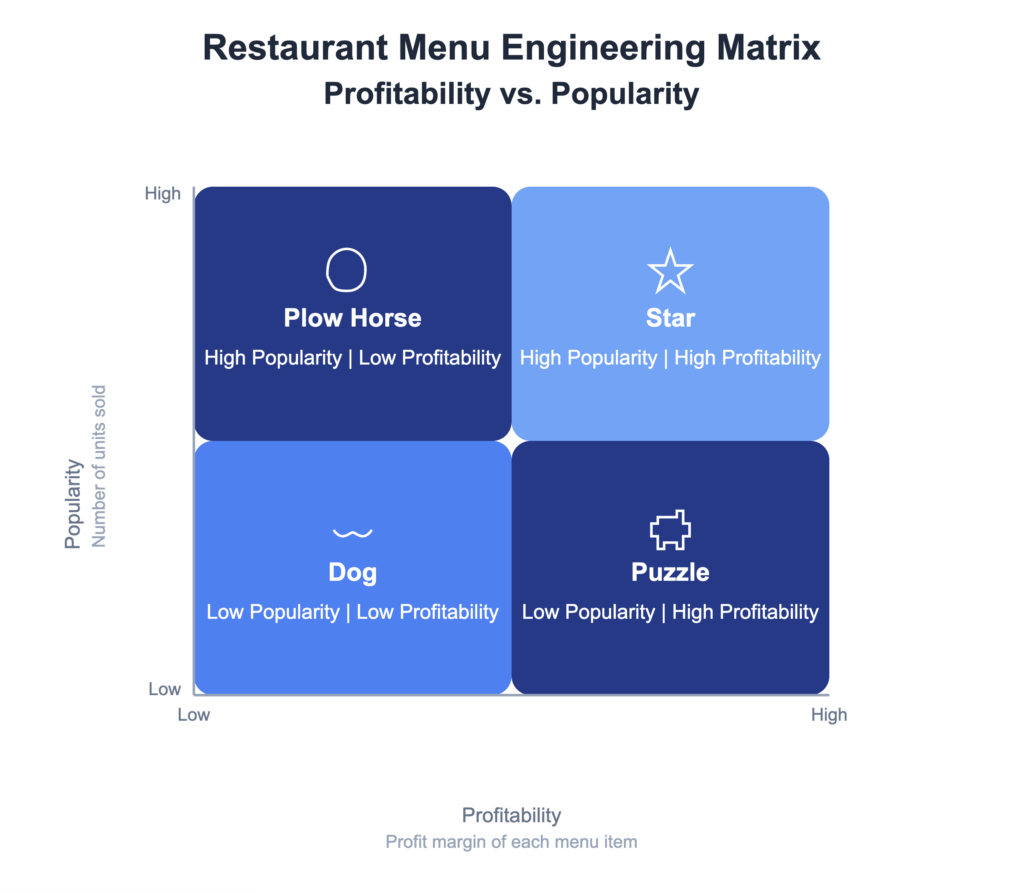
Stars are the crown jewels of your menu—these profitable and popular items create the perfect balance of high-profit margin and customer’s delight. These entrées not only showcase your culinary expertise but also drive substantial revenue. When you use a menu engineering matrix properly, you’ll quickly identify these treasures.
A perfectly executed steak from the grill with premium seasoning might be your signature Star commanding an excellent price while maintaining consistent demand. Stars often feature distinctive flavors or preparation techniques that justify their price point in the customer’s mind.
To maximize your Stars:
Remember that maintaining the quality of Stars is non-negotiable – any decline could quickly diminish their item’s popularity and profitability. When creating a menu, these items deserve your utmost attention.
Plowhorses are the beloved crowd-pleasers that keep customers coming back despite their lower profit margins. These popular items drive significant traffic but don’t contribute as substantially to your bottom line as you might hope. Classic comfort foods like certain pasta dishes or familiar sandwiches often fall into this category—items everyone loves but that may include costly ingredients or labor-intensive preparation.
The challenge with Plowhorses is enhancing their profitability without risking their popularity. Consider these approaches:
Plowhorses shouldn’t be removed—they’re essential crowd-pleasers that bring customers through your door. Instead, focus on strategic adjustments that can gradually improve their contribution while preserving their appeal. Even a small percentage increase in margin can significantly impact your overall profitability when multiplied across these high-volume sellers.
Puzzles are items with excellent profit potential but mysteriously low popularity. As their name suggests, puzzles are items that require solving—they’re profitable when ordered but don’t get selected frequently enough. These might include intricate specialty dishes, innovative fusion creations, or items using premium ingredients that customers hesitate to select.
To solve your Puzzles:
With puzzles, your goal is to increase visibility and appeal without sacrificing the high-profit margin that makes them valuable. A well-solved puzzle can transition into a Star, dramatically improving your menu’s performance. Using digital menu tools can make highlighting these items much easier, with the ability to feature photos and detailed descriptions.
Dogs represent the items that underperform in both profitability and popularity—the weakest performers on your menu. These might be dated offerings that no longer resonate with customers, dishes with escalating ingredient costs, or menu experiments that never gained traction. Dogs consume valuable menu space and kitchen resources while contributing minimally to your success.
When dealing with Dogs:
Sometimes, the best solution is to thank a Dog for its service and retire it gracefully. This allows your team to focus on items that better contribute to your restaurant’s success. The space on your menu takes valuable real estate – use it wisely.
While the concept of menu engineering is simple, implementing it effectively requires a structured approach. This comprehensive guide will help you transform every menu in your hospitality business through careful analysis and strategic adjustments. By following these steps, you’ll be able to visualize exactly how items from your menu are performing and make data-driven decisions to boost your profitability.
The foundation of any successful menu engineering analysis begins with robust data collection. Start by extracting detailed sales reports from your point-of-sale system covering at least a 30-90 day period. This timeframe provides sufficient data to identify genuine trends rather than temporary fluctuations.
Track the following for each menu item:
This data collection phase establishes your baseline for item popularity – one of the two critical axes in your menu engineering matrix. Modern restaurant management systems often allow you to export this data directly to spreadsheets for easier analysis.
Understanding exactly how much profit you make on each menu item requires meticulous cost analysis. For every entrée and dish:
This process reveals not just your food cost percentage but, more importantly, your contribution margin in absolute dollars – showing exactly how much each dish contributes to your bottom line. Many restaurant operators are surprised to discover that items with higher food cost percentages sometimes deliver greater absolute contribution margins than seemingly “cheaper” dishes.
Now comes the exciting part – engineering your menu by visualizing where each item falls on the matrix:
This visualization immediately reveals which items are Stars (high profit, high popularity), Plowhorses (low profit, high popularity), Puzzles (high profit, low popularity), and Dogs (low profit, low popularity). Seeing your menu through this lens often provides powerful “aha” moments that challenge long-held assumptions about your best-performing dishes.
Now that you understand where each item falls, develop targeted strategies for each quadrant:
For Stars:
For Plowhorses:
For Puzzles:
For Dogs:
Menu engineering is an ongoing cycle of refinement:
This iterative approach allows you to continuously optimize your menu’s performance. Many successful restaurants in the hospitality industry get industry-leading results by making menu engineering a regular part of their operational rhythm.
Remember that your menu is a living document that should evolve with changing food costs, customer preferences, and seasonal availability. Engineering your menu isn’t a one-time project but an ongoing process of refinement that can dramatically improve your restaurant’s profitability while enhancing the guest experience.
Using a platform like Menubly for your restaurant’s online menu makes this continuous improvement process significantly easier, allowing you to update items, adjust prices, and monitor performance without the expense and delay of reprinting physical menus.
Let’s examine how a global fast-food giant like Burger King might apply menu engineering principles to optimize their menu offerings. While we don’t have access to their actual internal data, we can analyze their menu structure through the lens of the engineering matrix based on observable patterns and industry knowledge.
Whopper and Whopper Variations The iconic Whopper sandwich is undoubtedly Burger King’s star performer. With a selling price around $5.29 and an estimated food cost of approximately $1.60, the Whopper delivers a strong contribution margin of roughly $3.69 (70%). Its brand recognition drives consistent sales volume, with an estimated 2,000+ units sold weekly per location.
Chicken Sandwich Burger King’s premium chicken sandwiches, particularly the Ch’King sandwich line, likely commands a selling price of around $5.99 with a food cost of approximately $1.80, generating a contribution margin of $4.19 (70%). These items enjoy strong popularity due to the fast-food “chicken sandwich wars” and likely sell 1,500+ units weekly per location.
Strategic Approach:
French Fries Burger King’s French fries are ordered with nearly every meal but deliver lower margins. With a selling price of around $2.69 (medium) and a food cost of approximately $0.75, they provide a contribution margin of $1.94 (72%). Though the percentage margin seems healthy, these items are frequently discounted in combo meals, reducing their effective contribution.
Value Menu Items The $1-$2 value menu items drive significant traffic but offer slim margins. For example, a basic cheeseburger priced at $1.49 with a food cost of approximately $0.60 produces a contribution margin of just $0.89 (60%) but might sell 2,500+ units weekly per location.
Strategic Approach:
Premium Shakes and Desserts Items like the Oreo Cookie Shake sell for around $3.99 with an estimated food cost of $1.00, delivering an excellent contribution margin of $2.99 (75%). However, these items might only sell 400-500 units weekly per location since they’re not part of the core offering.
Premium Specialty Sandwiches Limited-time offerings and specialty sandwiches often deliver excellent margins. Items like the Bacon King might sell for $6.99 with a food cost of $2.10, generating a hefty $4.89 (70%) contribution margin. However, these specialty items might only sell 600-700 units weekly per location.
Strategic Approach:
Specialty Salads When offered, garden salads typically underperform at fast-food chains. With a selling price around $5.29 and a food cost of approximately $2.10 (due to perishability and waste), they deliver a contribution margin of $3.19 (60%) but might sell only 200-300 units weekly per location.
Breakfast Specials Some breakfast items struggle with profitability and popularity. An item like French Toast Sticks might sell for $2.29 with a food cost of $0.90, delivering a contribution margin of $1.39 (61%). These might sell only 350-400 units weekly per location due to limited breakfast hours and competitive morning offerings.
Strategic Approach:
Over the years, Burger King has demonstrated menu engineering principles in several observable ways:
This analysis demonstrates how a major fast-food chain like Burger King likely applies menu engineering principles to optimize their menu mix, pricing strategy, and promotional focus. The continuous refinement of their menu over decades shows the ongoing nature of menu engineering as consumer preferences and food costs evolve.
By examining Burger King’s approach, restaurant operators of all sizes can learn how to apply similar strategic thinking to their own menu engineering efforts, tailoring the principles to their unique menu offerings and customer base.
The primary goal of menu engineering is to maximize a restaurant’s profitability by strategically analyzing and adjusting menu items based on their performance. Unlike traditional approaches that focus solely on food cost percentage, menu engineering takes a holistic view that considers both the profitability of each dish and its popularity with customers. This data-driven approach helps restaurants make informed decisions about menu design, placement, and menu planning that directly impact financial success while meeting customer expectations.
A menu matrix is a visual tool that plots menu items on a graph according to their profitability and popularity. The x-axis typically represents popularity (how frequently an item is ordered), while the y-axis represents profitability (usually measured by contribution margin). This visualization helps restaurant operators quickly identify which items fall into each of the four quadrants—Stars, Plow Horses, Puzzles, and Dogs. Understanding the components of a menu and how they fit into this matrix provides powerful insights for strategic decision-making.
The four quadrants in the menu engineering matrix represent different combinations of profitability and popularity:
Understanding the purpose of a menu beyond just listing items helps optimize your approach to each quadrant.
Menu engineering should be an ongoing process rather than a one-time exercise. Most restaurants benefit from conducting a full menu analysis quarterly, coinciding with seasonal changes that might affect ingredient costs or customer preferences. The importance of menu planning becomes evident when you consider how market conditions constantly change. For restaurants using digital menu solutions, updates can be implemented immediately without reprinting costs, making continuous optimization practical and cost-effective.
Calculating menu item profitability goes beyond simple food cost percentages. You’ll need to:
The contribution margin in dollars is typically more important than percentage when plotting your matrix, as it shows the actual profit each item brings to your restaurant.
Yes, menu engineering principles should be adapted based on your restaurant concept. The types of restaurants vary widely, from quick-service to fine dining, and each has different customer expectations and operational considerations. Similarly, understanding various types of menus helps you apply engineering principles in ways that match your service style and brand positioning.
The ultimate measure of successful menu engineering is improved profitability. Using a restaurant profit margin calculator can help you track changes in your overall margins. Beyond simple profit figures, success indicators include:
Remember that menu engineering is both an art and a science—blending data analysis with an understanding of your specific customer preferences and brand positioning.
Menu engineering is a powerful tool that transforms a restaurant’s menu from a simple list of dishes into a strategic profit driver. By categorizing items based on their profitability and popularity, restaurant owners gain valuable insights for data-driven decisions. Whether you’re promoting Stars, enhancing Plowhorses, solving Puzzles, or removing Dogs, this analytical approach leads to measurable improvements in your bottom line. Combined with digital menu solutions that allow for quick updates and testing, menu engineering creates a dynamic, responsive strategy that adapts to changing costs and customer preferences. Start implementing these principles today, and watch your restaurant’s profitability soar while enhancing customer satisfaction.